Understanding JVM and Garbage Collection with a Complex Java Program
Table of Contents
1. Understanding the Java Virtual Machine (JVM)
The Java Virtual Machine (JVM) is an abstract computing machine that enables a computer to run a Java program. The JVM performs various tasks such as loading class files, verifying bytecode, executing code, and managing runtime data areas. The key components of the JVM include the Class Loader, Bytecode Verifier, Just-In-Time (JIT) Compiler, and Garbage Collector.
2.JVM Internal Structure
The JVM's internal structure includes several key components that work together to execute Java programs efficiently:
- Class Loader Subsystem: Responsible for loading class files. It uses three class loaders: Bootstrap Class Loader, Extension Class Loader, and Application Class Loader.
- Runtime Data Areas: Divided into several memory areas:
- Method Area (Metaspace): Stores class-level data such as class definitions, static fields, and method data.
- Heap: The runtime data area from which memory for all class instances and arrays is allocated.
- Java Stacks: Each thread has its own stack, which stores frames. A frame contains local variables, an operand stack, and a reference to the constant pool.
- Program Counter (PC) Register: Contains the address of the currently executing instruction of the thread.
- Native Method Stack: Contains all native method information.
- Execution Engine: Executes the bytecode. It consists of:
- Interpreter: Interprets bytecode one instruction at a time.
- Just-In-Time (JIT) Compiler: Compiles bytecode into native machine code at runtime for better performance.
- Garbage Collector: Manages memory by reclaiming memory used by objects that are no longer referenced.
3.Example Java Program
public class ComplexExample {
    static int staticCounter = 0;
    int instanceCounter = 0;

    public ComplexExample() {
        staticCounter++;
        instanceCounter++;
    }

    public void displayCounter() {
        System.out.println("Instance Counter: " + instanceCounter);
    }

    public void displayCounter(String message) {
        System.out.println(message + ": " + instanceCounter);
    }

    public static void displayStaticCounter() {
        System.out.println("Static Counter: " + staticCounter);
    }

    public static void main(String[] args) {
        ComplexExample obj1 = new ComplexExample(1);
        ComplexExample obj2 = new ComplexExample(2);

        obj1.displayCounter();
        obj2.displayCounter("Message for obj2");

        ComplexExample.displayStaticCounter();

        // Suggest garbage collection
        obj1 = null;
        obj2 = null;
        System.gc();

        try {
            Thread.sleep(1000);
        } catch (InterruptedException e) {
            e.printStackTrace();
        }

        System.out.println("Garbage collection suggested.");
    }
}
4. Detailed Execution of the Program
When the program is run, the JVM performs the following steps:
- Class Loading: The JVM loads the
ComplexExample.classfile into the Method Area (Metaspace). - Object Creation: Instances
obj1andobj2are created in the Eden space of the Young Generation. - Static Field Initialization:
staticCounteris initialized and shared among all instances. - Method Invocation: Various methods are called, demonstrating the use of static and instance fields.
5. Memory Management in JVM
Memory in the JVM is divided into several areas:
- Method Area (Metaspace): Stores class-level data including static fields.
- Heap: Allocates memory for object instances and instance variables.
- Java Stacks: Each thread has its own stack containing frames for method calls, local variables, and operand stacks.
6. Garbage Collection in JVM
Garbage Collection (GC) is the process of automatically identifying and reclaiming memory that is no longer in use. The JVM uses a generational approach, dividing the heap into the Young Generation and Old Generation.
- Young Generation: Where new objects are created. It consists of the Eden space and two Survivor spaces.
- Old Generation: Where long-lived objects are moved after surviving multiple GC cycles.
GC involves marking reachable objects, sweeping and reclaiming memory of unreachable objects, and optionally compacting memory to reduce fragmentation.
7. How to Trigger Garbage Collection in the Example Program
In the example program, garbage collection can be suggested using System.gc(). This makes obj1 and obj2 eligible for GC by setting them to null. Note that System.gc() is only a request and not a guarantee that GC will occur immediately.
obj1 = null;
obj2 = null;
System.gc();
This request is followed by a short delay to allow time for GC to run.
8. Monitoring Garbage Collection activity and Heap
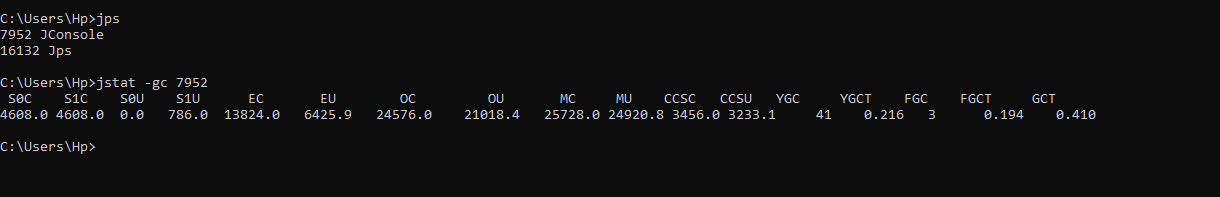
- Monitoring garbage collection with jstat Use jstat -gc $JAVA_PID to monitor gc
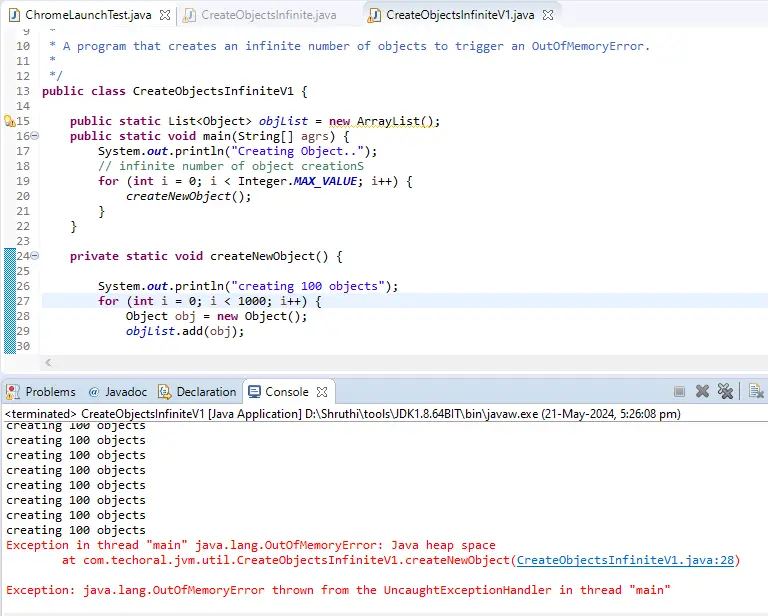
- Monitoring garbage collection with the jconsole user interface 1) Run the Java Program provided in the git repository, which causes jvm to go outofmemory.
https://github.com/deonash/techoral-git
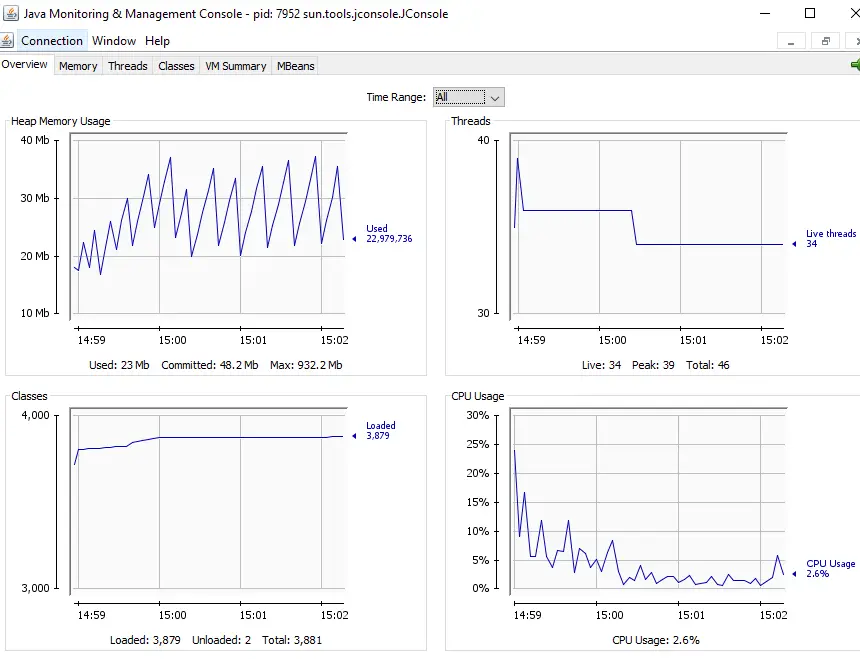
2) Use jconsole command to launch Jconsole Interface. Select running java process to monitor the heap usage.
after few minutes, above program fails with OutOfMemoryError as shown below.
How Launch Jconsole - Quick Tip :
Watch Video on YouTube
9. Conclusion
The JVM is a powerful component of the Java platform, enabling efficient execution and memory management of Java programs. Understanding how the JVM manages memory and performs garbage collection helps developers write more efficient and optimized code. Using techniques like requesting GC can help manage memory, but it should be done with an understanding of its non-deterministic nature.
10. References
Archives
- Java is not recognized
- IntellijIdea Installation guide
- Java Reserved vs Contextual Keywords
- Java ERROR code 1603
- Procyon Java Decompiler
- Resultset has now rows. Quick Fix!
- Java Update on Mac
- Java Update check fails
- Java wont install on windows 10
- Java installation error code 80
- Windows does not recognize java
- Access Adobe programs Java
- Failed to install java update
- System breaks jdk8 javac command
- Java Uninstall Stops at Progress Bar
- Could not find java dll
- Eclipse Error code 13
- ERROR - Postgresql Jdbc Driver
- Java Garbage Collection
- Input mismatch exception in java
- Error Connecting Postgresql
- Multithreading in Java
- Java Collection Code Challenge