Spring Boot ELK - ElasticSearch, Logstash and Kibana integration
Here is the example of how to push your spring boot logs to elasticsearch and view them on Kibana.
On a high level, logstash reads the log files and restructure them as per the Grok pattern mentioned in the logstash.conf file. Then logstash pushes the formatted logs to elasticsearch.
Once logs are indexed in elasticsearch, we can view them on Kibana. Below are the step by step procedure on how to setup Spring Boot ELK stack real quick.
1. ElasticSearch Download and Installation on windows.
Go to the below link and download the elasticsearch. Once downloaded successfully unzip it to the convenient directory. As shown below.
https://www.elastic.co/downloads/elasticsearch
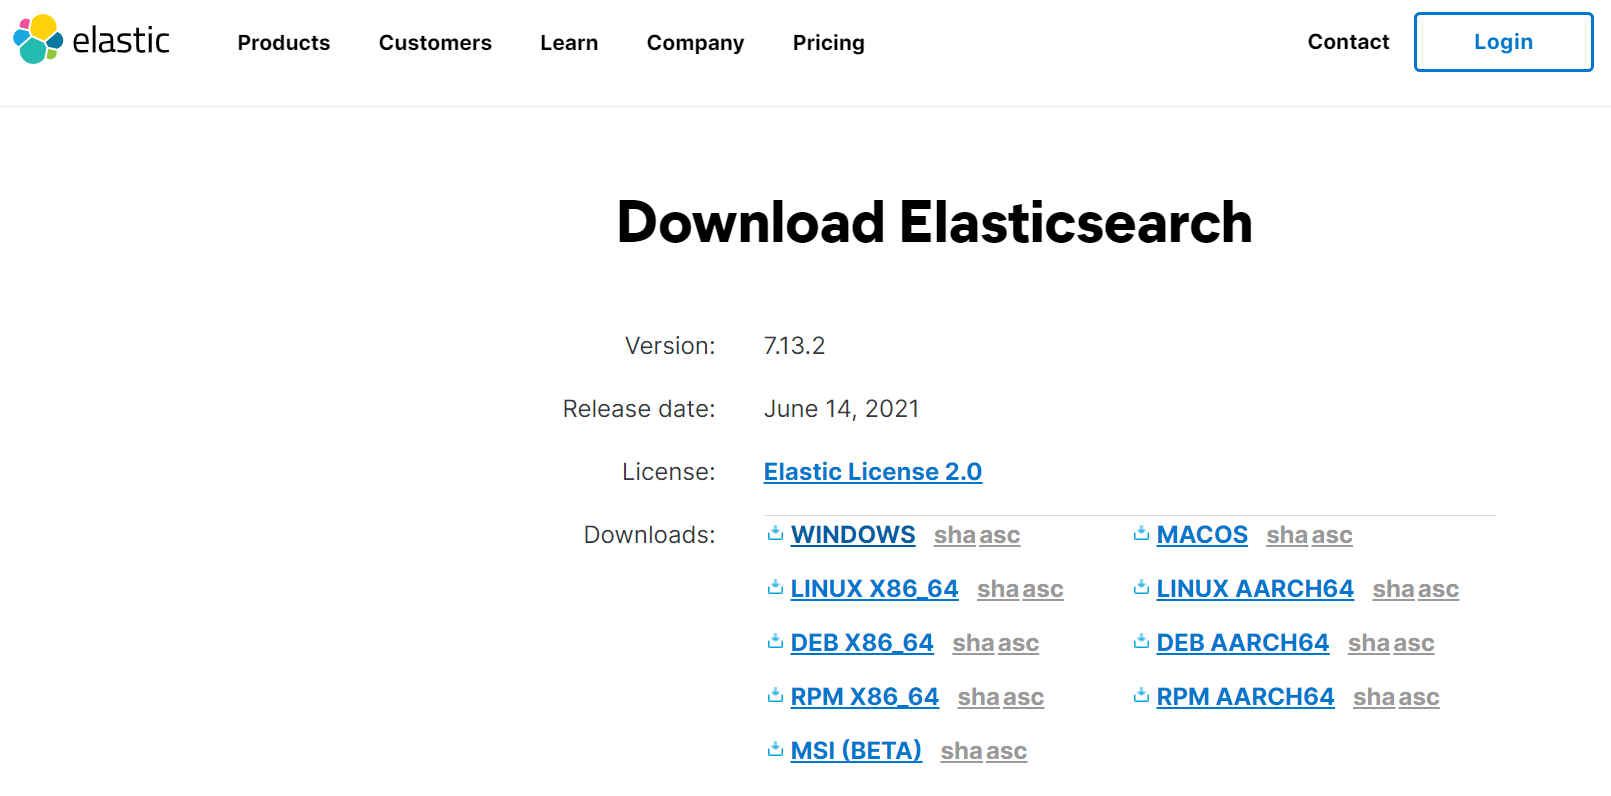
Figure 1 download elasticsearch
Extract the downloaded zip file to a convenient directory.
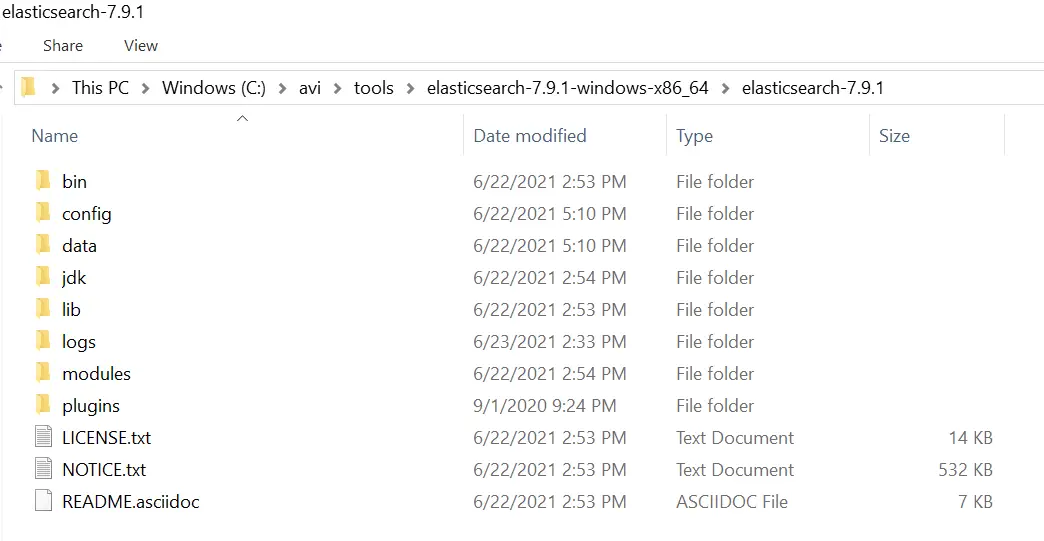
Figure 2 Extract elasticsearch zip to convenient directory
Go to the bin directory and run elasticsearch.bat file
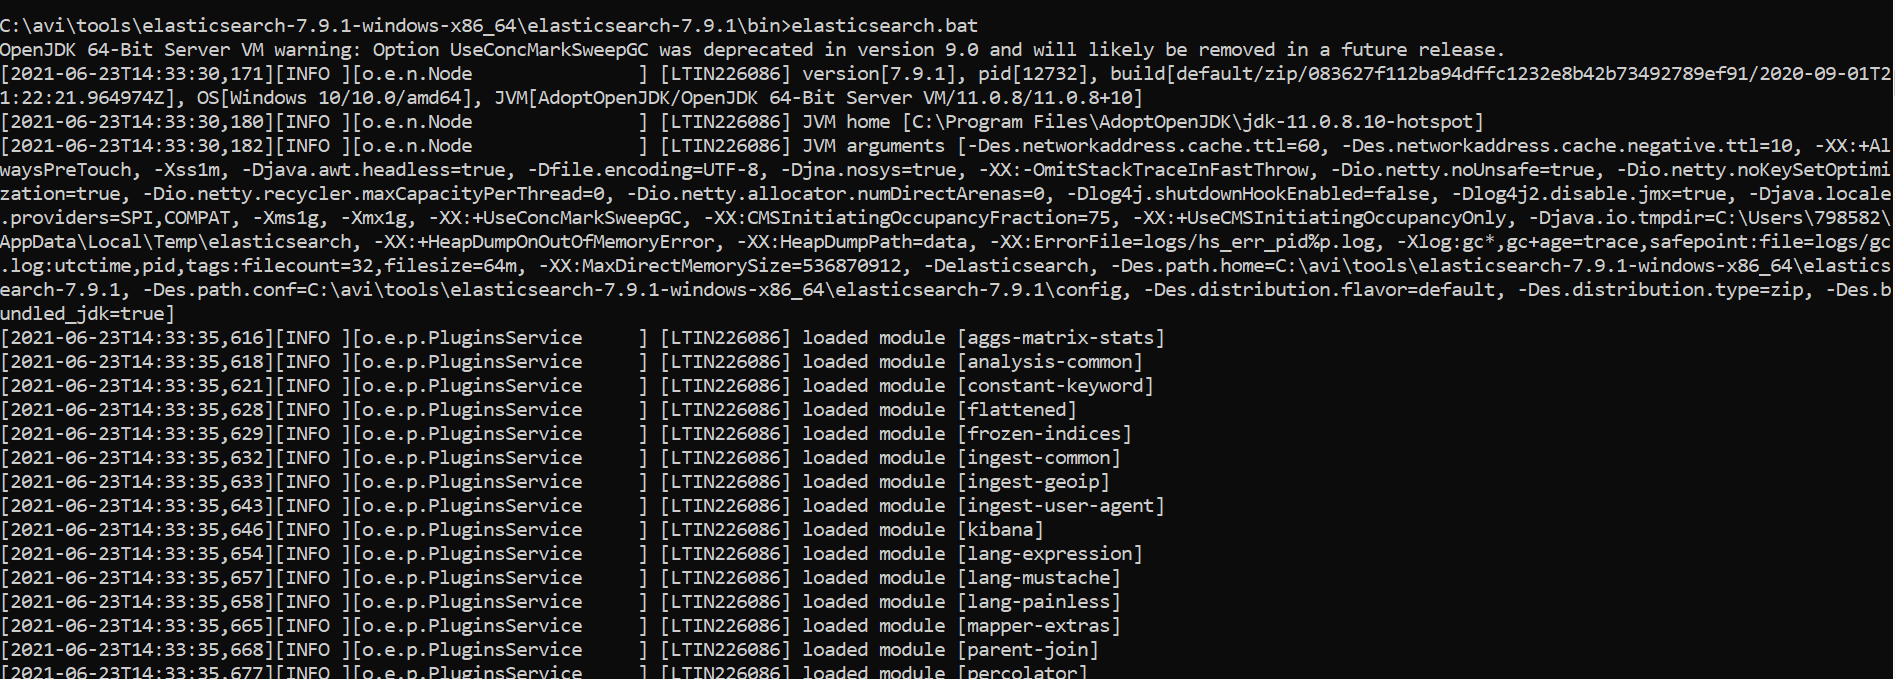
Figure 3 run elasticsearch batch file
Once started, go to http://localhost:9200/ and check if the elasticsearch is up, you should see response shown below.
// 20210623195536
// http://localhost:9200/
{
"name": "LTIN226086",
"cluster_name": "elasticsearch",
"cluster_uuid": "2OxlwunqSsOk0sPnhizlrg",
"version": {
"number": "7.9.1",
"build_flavor": "default",
"build_type": "zip",
"build_hash": "083627f112ba94dffc1232e8b42b73492789ef91",
"build_date": "2020-09-01T21:22:21.964974Z",
"build_snapshot": false,
"lucene_version": "8.6.2",
"minimum_wire_compatibility_version": "6.8.0",
"minimum_index_compatibility_version": "6.0.0-beta1"
},
"tagline": "You Know, for Search"
}
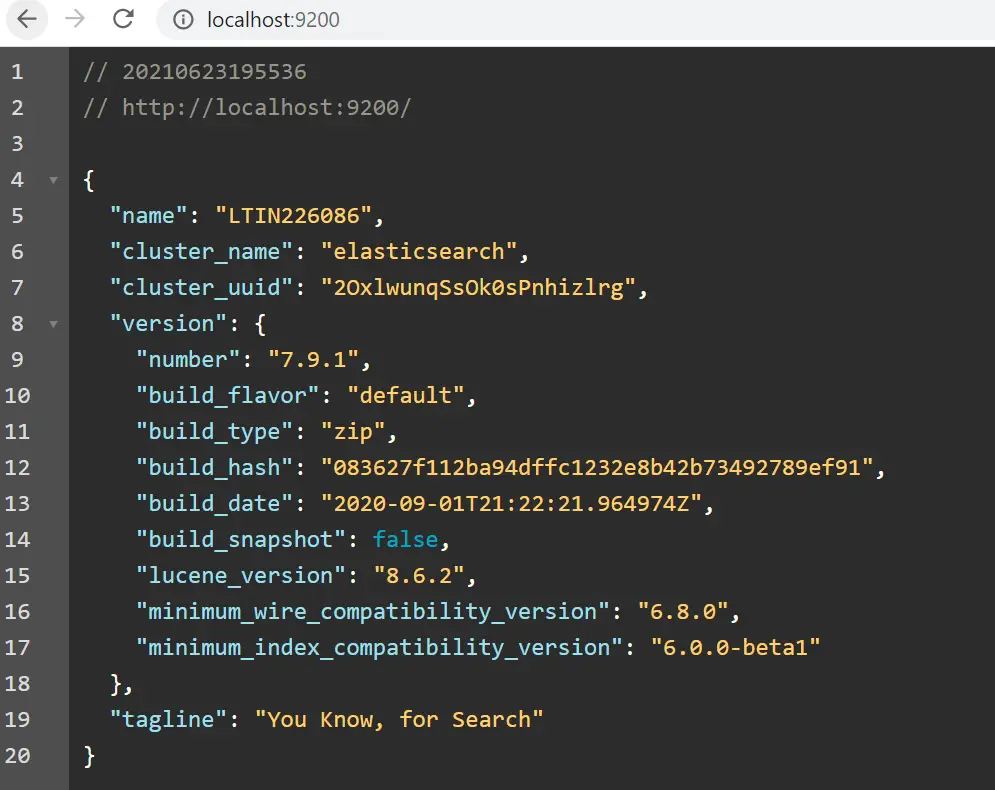
Figure 4 elasticsearch Health Check
Note:
Elasticsearch Batch file run would fail if Java is not installed. Elasticsearch Batch run would fail with below error.
If java is not installed on your system, please refer How to Install Java on Windows
Microsoft Windows [Version 10.0.17763.1935]
(c) 2018 Microsoft Corporation. All rights reserved.

C:\avi\tools\elasticsearch-7.9.1-windows-x86_64\elasticsearch-7.9.1\bin>elasticsearch.bat
"could not find java in JAVA_HOME at "C:\Program Files\AdoptOpenJDK\jdk-11.0.8.10-hotspot\bin\bin\java.exe""

C:\avi\tools\elasticsearch-7.9.1-windows-x86_64\elasticsearch-7.9.1\bin>
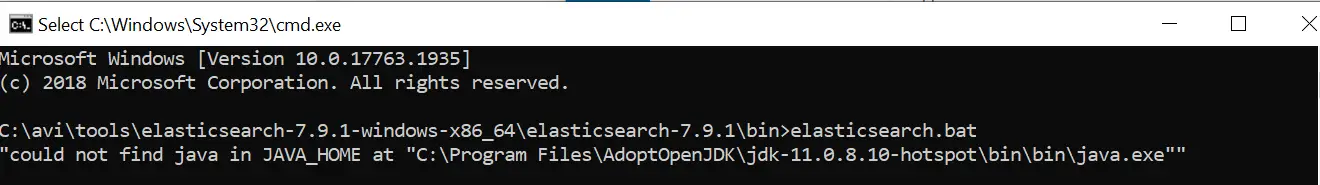
Figure 4.1 Elasticsearch : Could not find java error
2. Kibana Download and Installation on windows.
Go to the link https://www.elastic.co/downloads/kibana and download the kibana latest version. Once downloaded extract it to convenient directory.
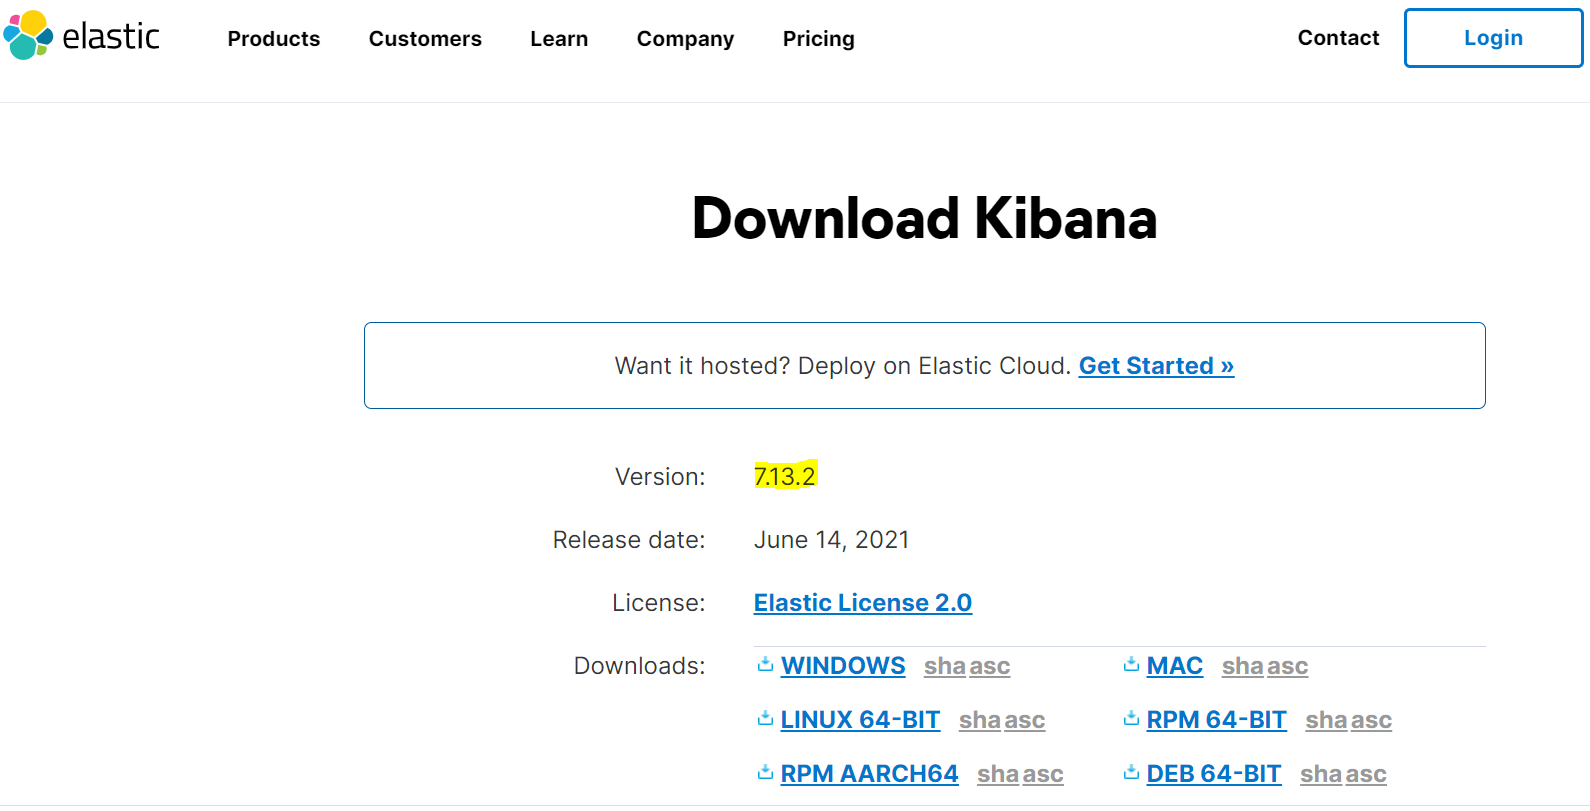
Figure 5 Download and install kibana
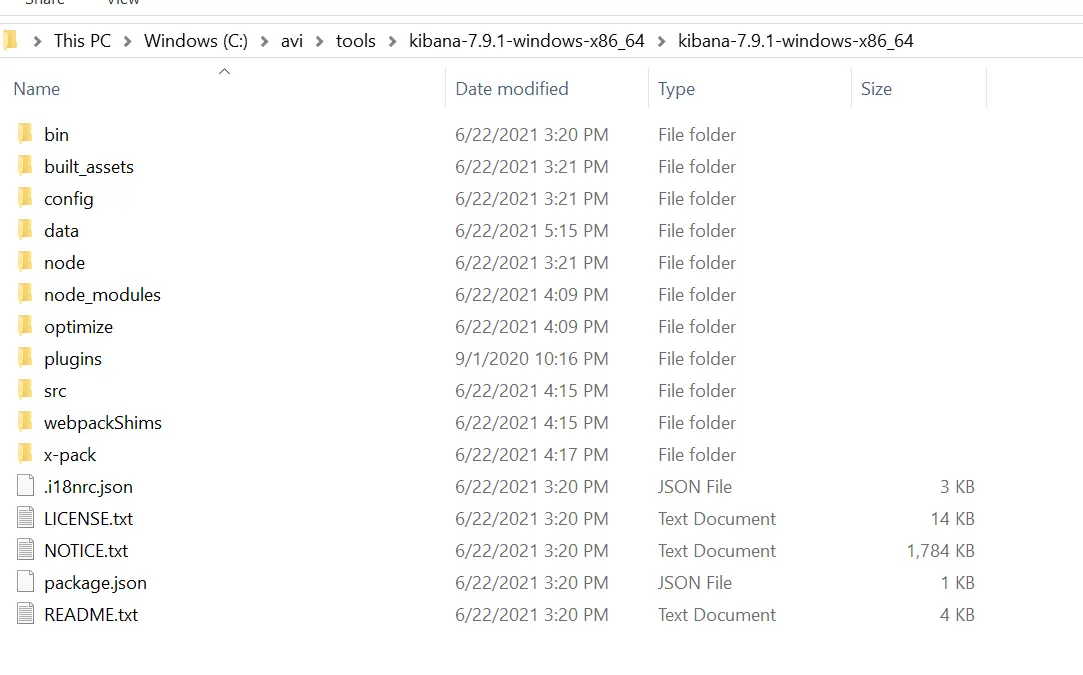
Extract kibana to a convenient directory.
 Figure
6
Extract Kibana to a convenient directory
Figure
6
Extract Kibana to a convenient directory
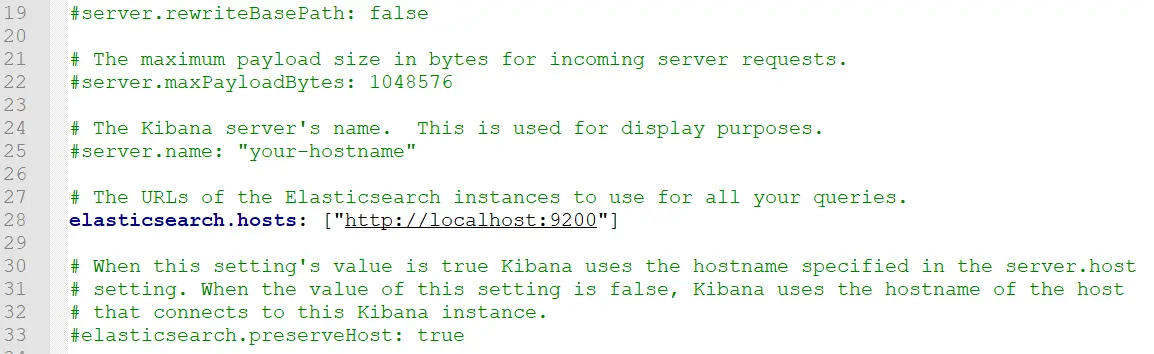
Go to kibana config directory add the Elasticsearch url to the kibana.yml file
# The Kibana server's name. This is used for display purposes.
#server.name: "your-hostname"
# The URLs of the Elasticsearch instances to use for all your queries.
elasticsearch.hosts: ["http://localhost:9200"]
# When this setting's value is true Kibana uses the hostname specified in the server.host
# setting. When the value of this setting is false, Kibana uses the hostname of the host
# that connects to this Kibana instance.
#elasticsearch.preserveHost: true
 Figure
7
kibana.yml configuration
Figure
7
kibana.yml configuration
Run the kibana.bat file as shown below.
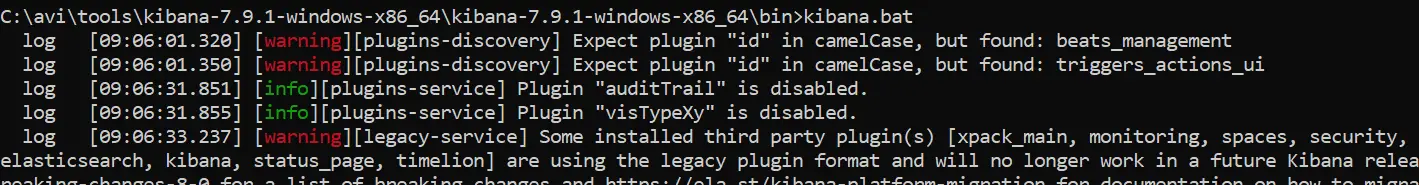
Figure 8 Run Kibana.bat file
Once started, go to the link http://localhost:5601/ and verify
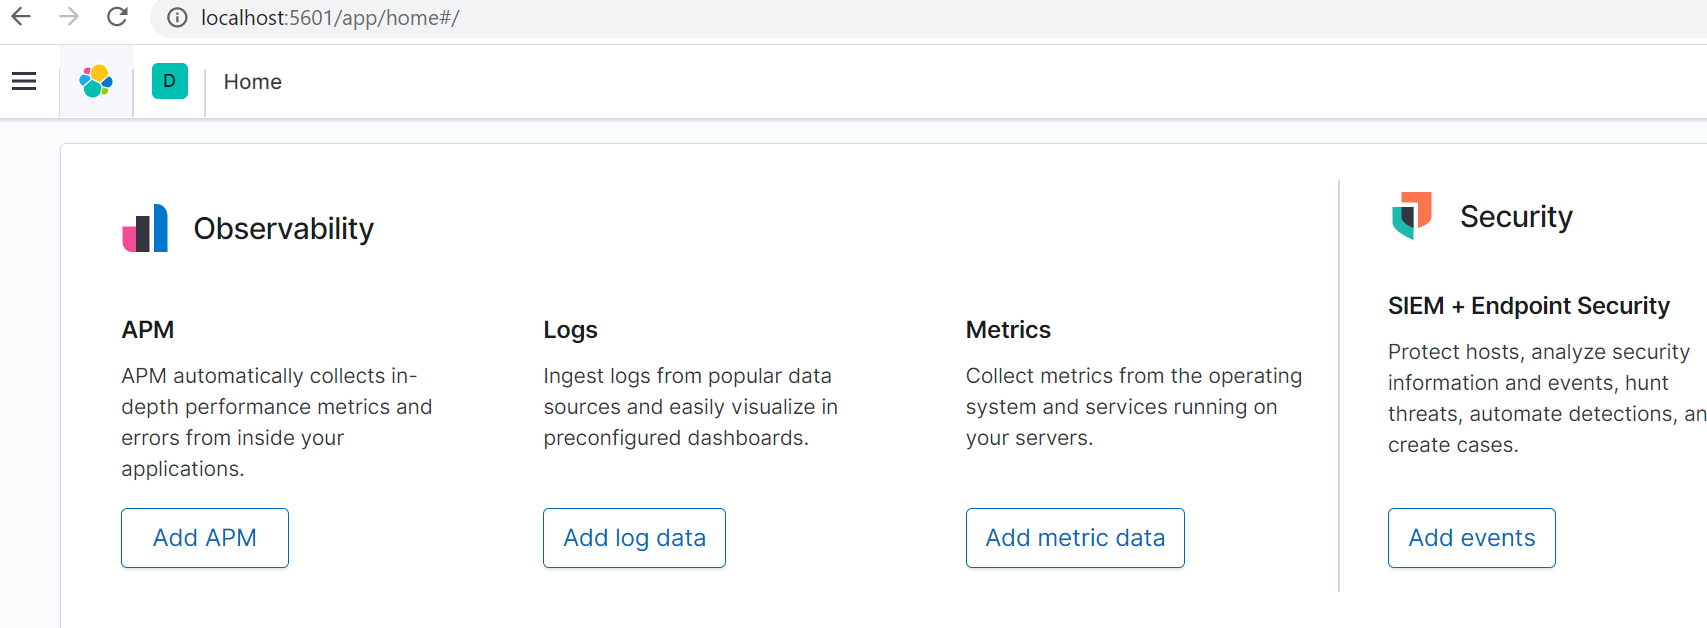
Figure 9 kibana dashboard
Kibana should be up and running as shown above.
Note:
Kibana Batch file run would fail if Elasticsearch is not up and running. Kibana Batch run would fail with " Unable to revive connection: http://localhost:9200/" error.
C:\avi\tools\kibana-7.9.1-windows-x86_64\kibana-7.9.1-windows-x86_64\bin>kibana.bat
  log   [05:19:41.685] [warning][plugins-discovery] Expect plugin "id" in camelCase, but found: beats_management
  log   [05:19:41.702] [warning][plugins-discovery] Expect plugin "id" in camelCase, but found: triggers_actions_ui
  log   [05:20:03.965] [info][plugins-service] Plugin "auditTrail" is disabled.
  log   [05:20:03.966] [info][plugins-service] Plugin "visTypeXy" is disabled.
GET http://localhost:9200/_nodes?filter_path=nodes.*.version%2Cnodes.*.http.publish_address%2Cnodes.*.ip => connect ECONNREFUSED 127.0.0.1:9200
  log   [05:20:06.155] [error][elasticsearch][monitoring] Request error, retrying
GET http://localhost:9200/_xpack => connect ECONNREFUSED 127.0.0.1:9200
  log   [05:20:07.169] [warning][elasticsearch][monitoring] Unable to revive connection: http://localhost:9200/
  log   [05:20:07.169] [warning][elasticsearch][monitoring] No living connections
  log   [05:20:07.170] [warning][licensing][plugins] License information could not be obtained from Elasticsearch due to Error: No Living connections error
  log   [05:20:07.179] [warning][monitoring][monitoring][plugins] X-Pack Monitoring Cluster Alerts will not be available: No Living connections
  log   [05:20:07.376] [info][savedobjects-service] Waiting until all Elasticsearch nodes are compatible with Kibana before starting saved objects migrations...
  log   [05:20:07.377] [warning][data][elasticsearch] Unable to revive connection: http://localhost:9200/
  log   [05:20:07.379] [warning][data][elasticsearch] No living connections
  log   [05:20:07.380] [error][savedobjects-service] Unable to retrieve version information from Elasticsearch nodes.
  log   [05:20:07.385] [warning][elasticsearch][monitoring] Unable to revive connection: http://localhost:9200/
  log   [05:20:07.386] [warning][elasticsearch][monitoring] No living connections
  log   [05:20:07.387] [warning][licensing][plugins] License information could not be obtained from Elasticsearch due to Error: No Living connections error
  log   [05:20:08.657] [warning][data][elasticsearch] Unable to revive connection: http://localhost:9200/
  log   [05:20:08.657] [warning][data][elasticsearch] No living connections
  log   [05:20:11.175] [warning][data][elasticsearch] Unable to revive connection: http://localhost:9200/
  log   [05:20:11.176] [warning][data][elasticsearch] No living connections
  log   [05:20:11.428] [info][plugins-system] Stopping all plugins.
 log   [05:21:28.873] [warning][licensing][plugins] License information could not be obtained from Elasticsearch due to Error: No Living connections error
  log   [05:21:28.879] [warning][data][elasticsearch] Unable to revive connection: http://localhost:9200/
  log   [05:21:28.879] [warning][data][elasticsearch] No living connections
  log   [05:21:28.880] [error][savedobjects-service] Unable to retrieve version information from Elasticsearch nodes.
  log   [05:21:30.142] [warning][data][elasticsearch] Unable to revive connection: http://localhost:9200/
  log   [05:21:30.142] [warning][data][elasticsearch] No living connections
  log   [05:21:32.646] [warning][data][elasticsearch] Unable to revive connection: http://localhost:9200/
  log   [05:21:32.646] [warning][data][elasticsearch] No living connections
  log   [05:21:35.151] [warning][data][elasticsearch] Unable to revive connection: http://localhost:9200/
  log   [05:21:35.151] [warning][data][elasticsearch] No living connections
  log   [05:21:37.656] [warning][data][elasticsearch] Unable to revive connection: http://localhost:9200/
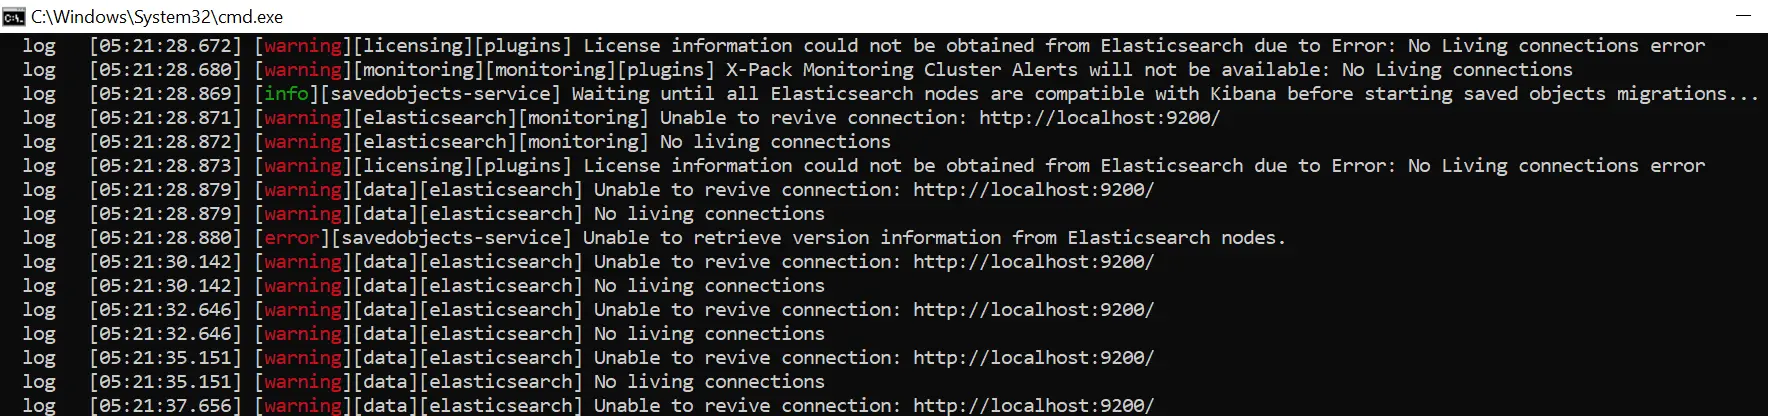
Figure 9.1 Kibana unable to revive connection error
Makes sure Elasticsearch is up and running, before starting Kibana
Until now we have successfully configured Elasticsearch and Kibana. And now we have to push spring boot logs to Elasticsearch via logstash.
3. Download and install Logstash on windows
Go to the link https://www.elastic.co/downloads/logstash and download Logstash latest version.
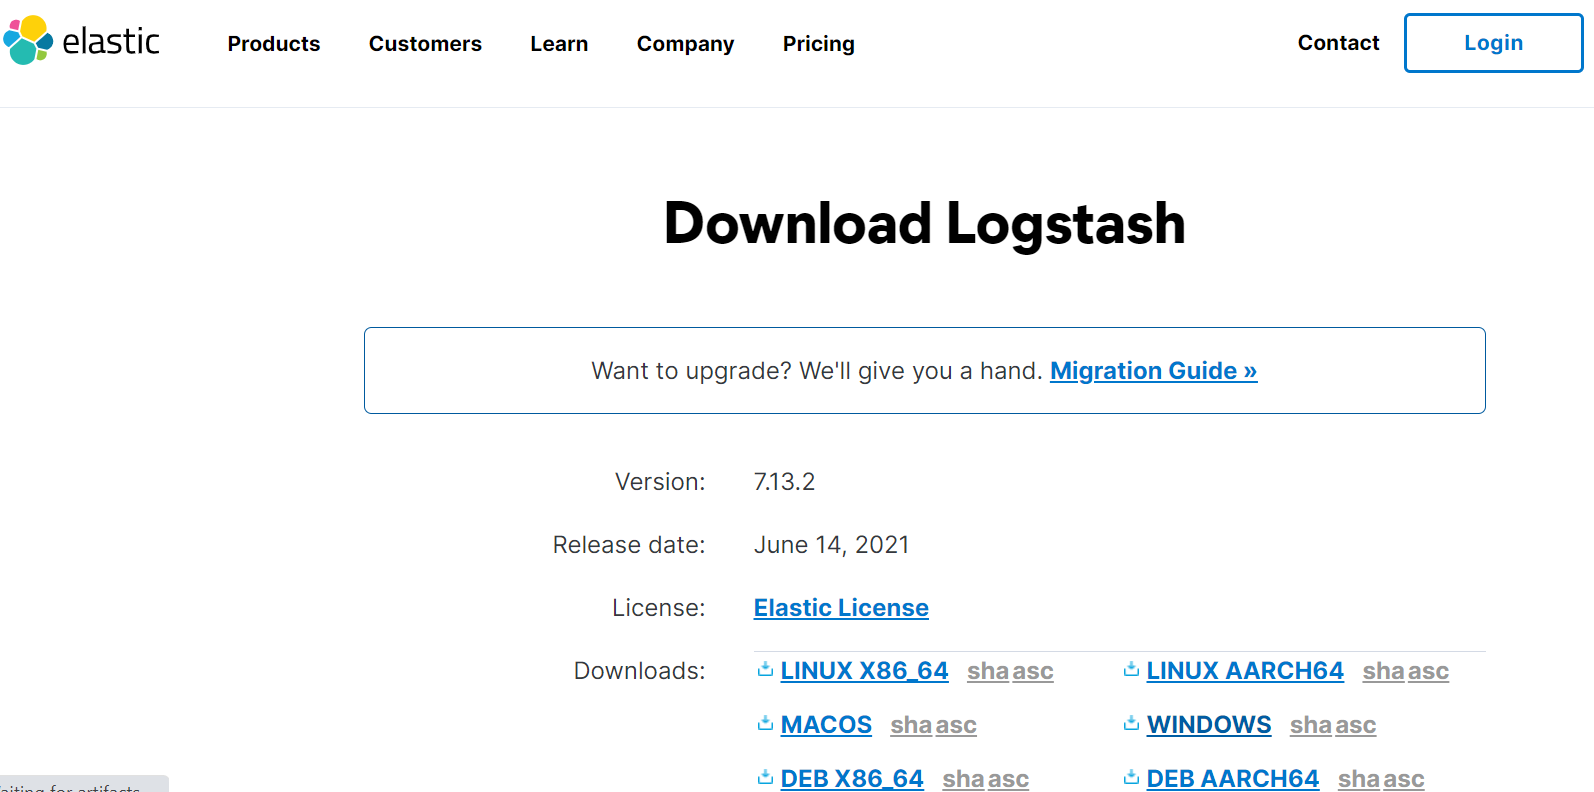
Figure 10 Download Logstash
Extract it to convenient directory as shown below.
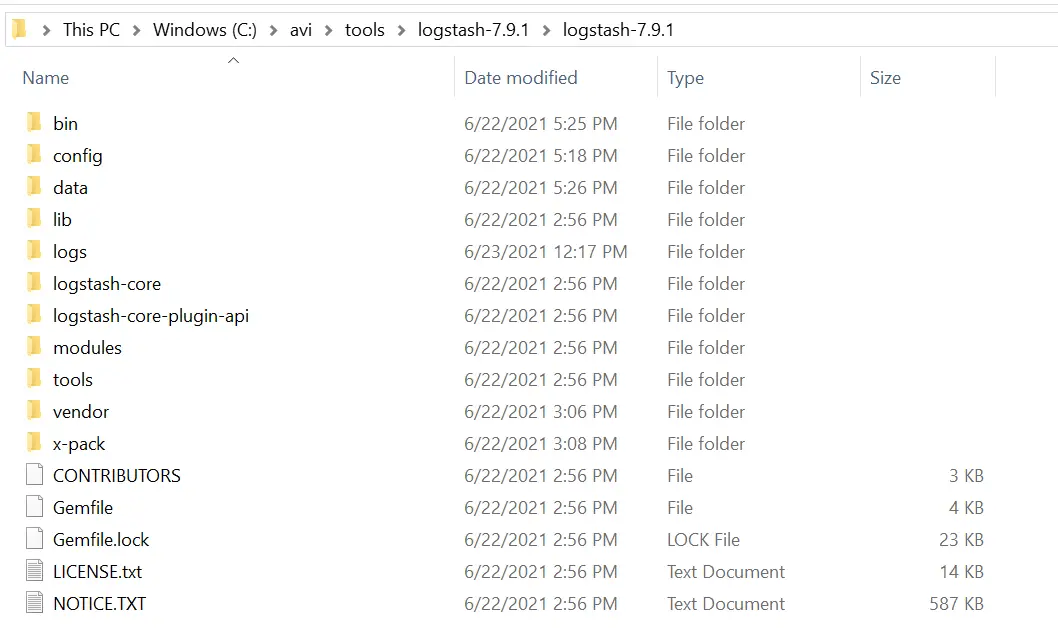
Figure 11 Extract Logstash to directory
Add logstash.conf file to bin directory
Note: Filters Logstash
Logstash filters ( Grok Pattern ) are used to match the log text. Below logstash filter example shows how to
match and read springboot / apache tomcat formated logs.
# Sample Logstash configuration for creating a simple
# Beats -> Logstash -> Elasticsearch pipeline.
input {
file { path => "C:/avi/career/eclipsespacephoton2/ELK-SB-Service/logs/sv-log-mgmt.log"
}
}
filter {
grok {
match => { "message" =>
"(?<timestamp>%{YEAR}-%{MONTHNUM}-%{MONTHDAY} %{TIME}) %{LOGLEVEL:level} %{GREEDYDATA:class} \[%{GREEDYDATA:thread}\] (?<logmessage>.*)"
}
}
}
output {
elasticsearch {
hosts => ["http://localhost:9200"]
index => "cts_sv_logs"
#index => "%{[@metadata][beat]}-%{[@metadata][version]}-%{+YYYY.MM.dd}"
#user => "elastic"
#password => "changeme"
}
stdout {
codec => rubydebug{
metadata => true # Here, we will print metadata in console
}
}
}
Once Added, run the logstash by running below command.
logstash.bat -f logstash.conf –verbose
Logstash should be up and running. As shown below
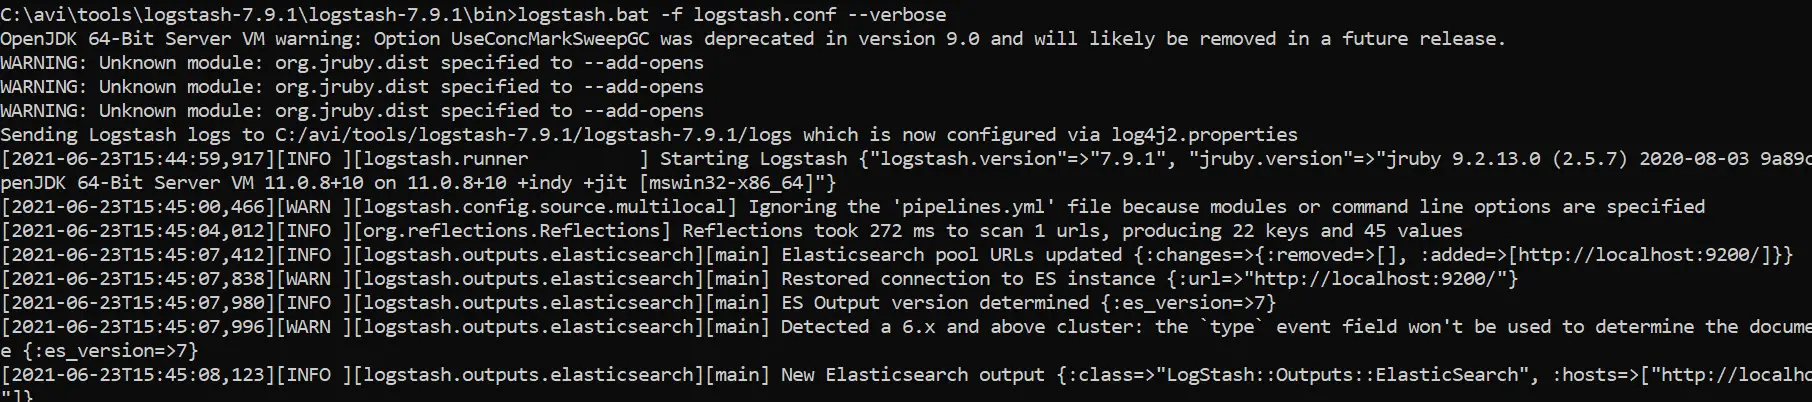
Figure 12 Run Logstash
Once started, logstash will read the spring boot log file mentioned the logstas.conf path variable and pushes the formatted log to Elasticsearch, there by making it visible on kibana as shown below.
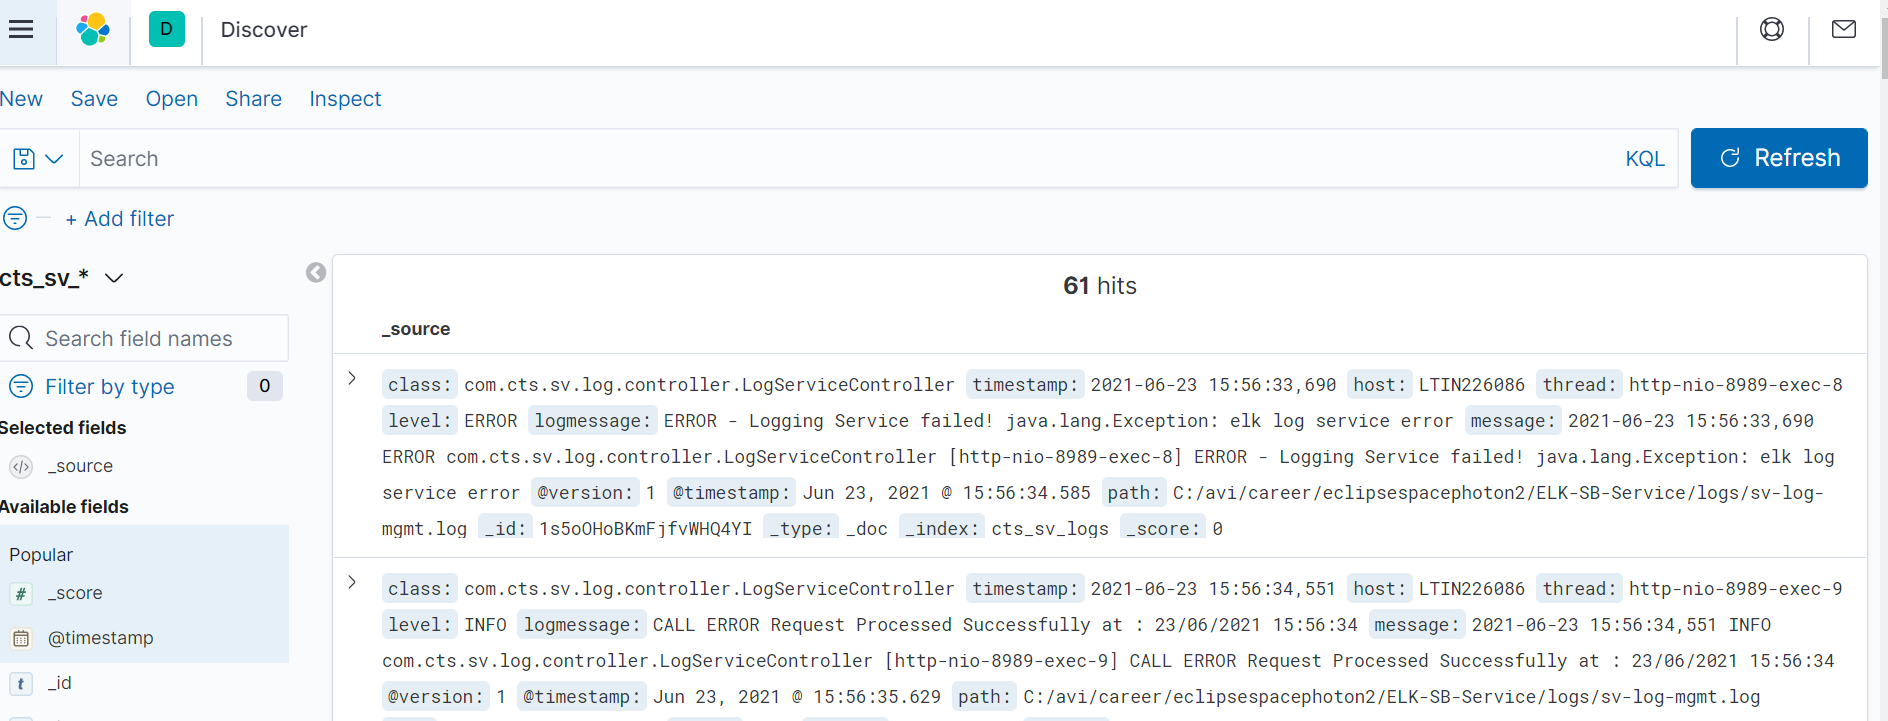
Figure 13 view logs on kibana
Note:
Logstash Batch file run would fail if Java is not installed. Logstash Batch run would fail with below error.
If java is not installed on your system, please refer How to Install Java on Windows
Microsoft Windows [Version 10.0.17763.1935]
(c) 2018 Microsoft Corporation. All rights reserved.

C:\avi\tools\logstash-7.9.1\logstash-7.9.1\bin>logstash.bat
could not find java; set JAVA_HOME or ensure java is in PATH

C:\avi\tools\logstash-7.9.1\logstash-7.9.1\bin>
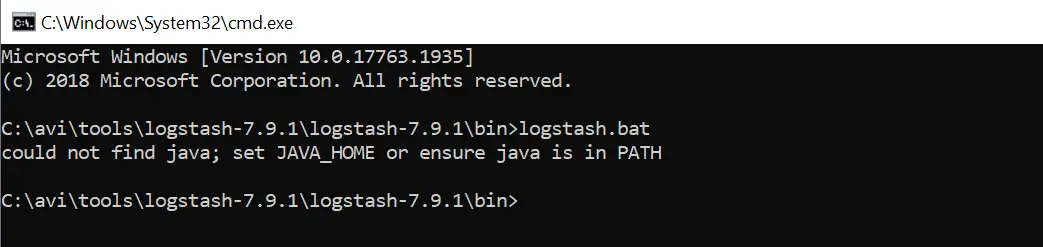
Figure 4.1 Logstash : Could not find java; set JAVA_HOME or ensure java is in PATH error
4. Spring boot service that generates logs
Here is the spring boot service project that writes logs to logs/sv-log-mgmt.log file. This spring boot logging services consist of two services
/callerror (logs the dummy errors) and /callelk (logs the service info). You can download the same from the below link.
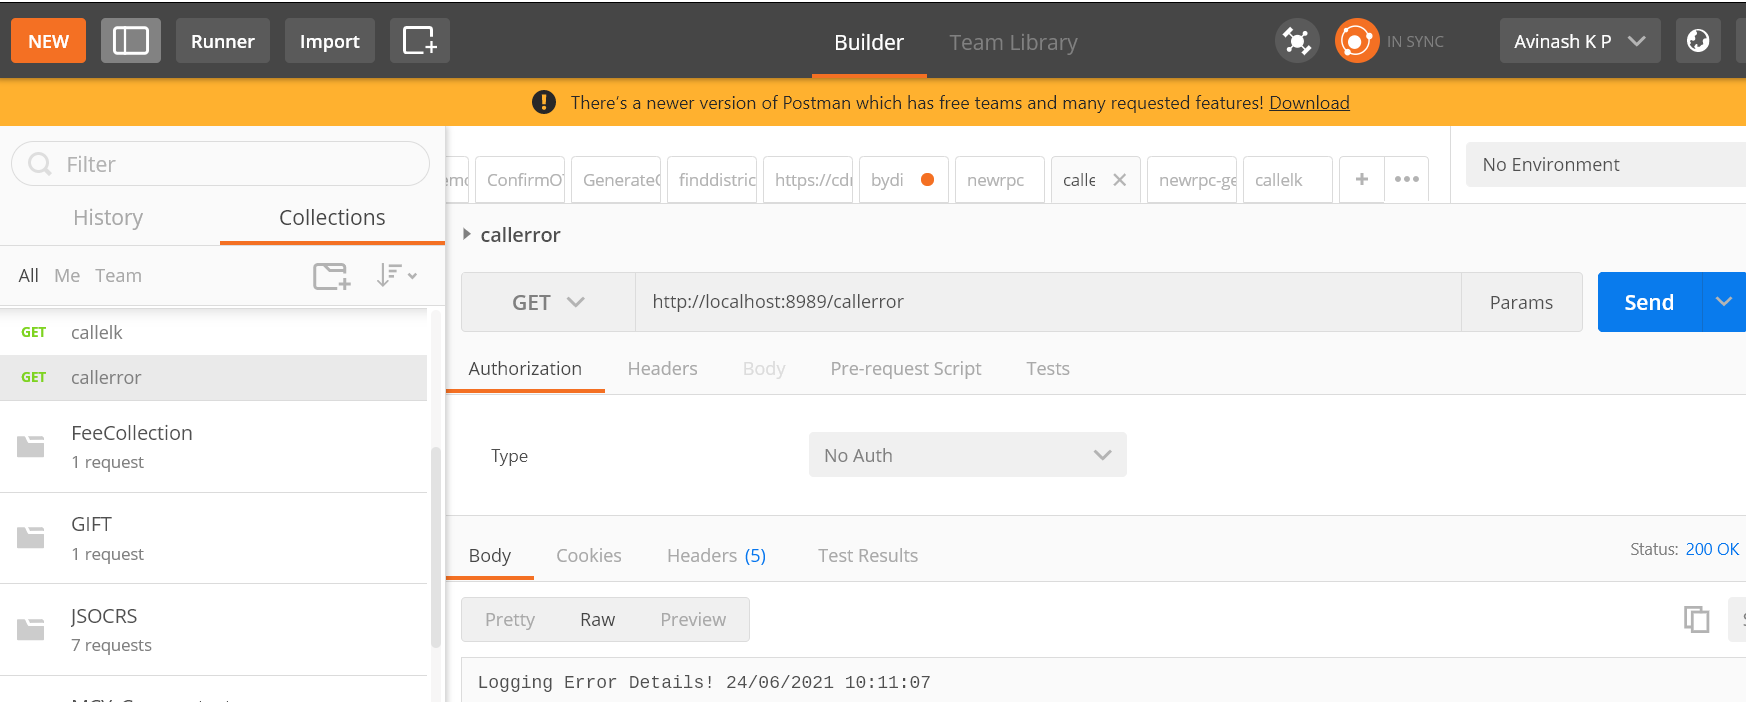
Figure 14 Spring boot log postman
Download Spring Boot Logging Example : ELK-SB-Service.zip
5. ELS Stack Troubleshooting
Known issues and resolution
Read Next :
- Java is not recognized
- IntellijIdea Installation guide
- Java Reserved vs Contextual Keywords
- Java ERROR code 1603
- Java Update on Mac
- Java Update check fails
- Java wont install on windows 10
- Java installation error code 80
- Windows does not recognize java
- Access Adobe programs Java
- Failed to install java update
- System breaks jdk8 javac command
- Java Uninstall Stops at Progress Bar
- Could not find java dll
Search
Archives
- Java is not recognized
- IntellijIdea Installation guide
- Java Reserved vs Contextual Keywords
- Java ERROR code 1603
- Java Update on Mac
- Java Update check fails
- Java wont install on windows 10
- Java installation error code 80
- Windows does not recognize java
- Access Adobe programs Java
- Failed to install java update
- System breaks jdk8 javac command
- Java Uninstall Stops at Progress Bar
- Could not find java dll
- ERROR - Postgresql Jdbc Driver
- Java Garbage Collection
- Input mismatch exception in java
- Error Connecting Postgresql
- Multithreading in Java
- Java Collection Code Challenge
Code Camp!
email: info@techoral.com