JVM Monitoring Tools: A Comprehensive Guide (2025)

Effective JVM monitoring is crucial for maintaining application performance and identifying potential issues. This guide explores essential JVM monitoring tools, their installation, and usage.
Table of Contents
JConsole
Installation
JConsole comes bundled with the JDK. To verify installation:
# Check JConsole version
jconsole -version

# Launch JConsole
jconsole
Usage
1. Connect to a local JVM:
jconsole [pid]
2. Connect to a remote JVM:
jconsole hostname:port
3. Enable JMX for remote connections:
java -Dcom.sun.management.jmxremote \
     -Dcom.sun.management.jmxremote.port=9999 \
     -Dcom.sun.management.jmxremote.authenticate=false \
     -Dcom.sun.management.jmxremote.ssl=false \
     YourApplication

VisualVM
Installation
1. Download VisualVM:
# For Windows
# Download from https://visualvm.github.io/download.html

# For Linux
sudo apt-get install visualvm

# For macOS
brew install visualvm
Usage
1. Launch VisualVM:
visualvm
2. Install recommended plugins:
- Visual GC
- BTrace Workbench
- JFR

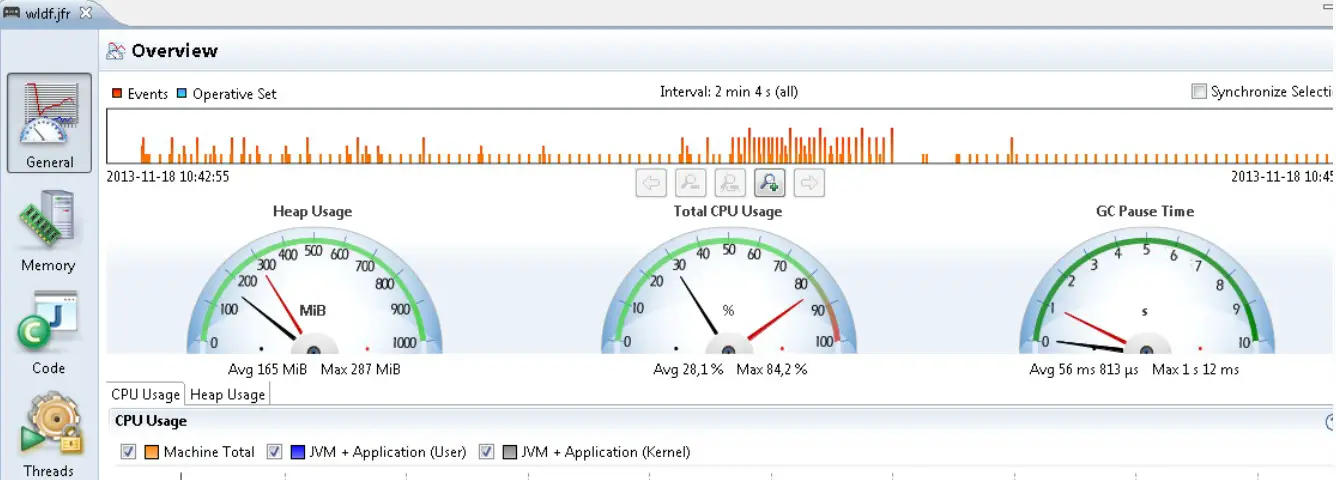
Java Flight Recorder
Installation
JFR is included with the JDK. Enable it with:
java -XX:StartFlightRecording=duration=60s,filename=recording.jfr YourApplication
Usage
1. Start a recording:
// Using Java Mission Control
jcmd  JFR.start duration=60s filename=recording.jfr

// Using JMX
MBeanServerConnection mbeanServer = ManagementFactory.getPlatformMBeanServer();
ObjectName objectName = new ObjectName("jdk.jfr:type=FlightRecorder");
mbeanServer.invoke(objectName, "start",
    new Object[]{new RecordingOptions()},
    new String[]{"jdk.jfr.RecordingOptions"});
2. Stop a recording:
// Using Java Mission Control
jcmd  JFR.stop name=1

// Using JMX
mbeanServer.invoke(objectName, "stop",
    new Object[]{new RecordingOptions()},
    new String[]{"jdk.jfr.RecordingOptions"});

JProfiler
Installation
1. Download JProfiler:
# Download from https://www.ej-technologies.com/products/jprofiler/overview.html
2. Install the agent:
# For Windows
jpenable

# For Linux/macOS
./jpenable
Usage
1. Configure profiling options:
// Add to JVM arguments
-agentpath:/path/to/jprofiler/bin/linux-x64/libjprofilerti.so=port=8849
2. Start profiling:
// Using JMX
MBeanServerConnection mbeanServer = ManagementFactory.getPlatformMBeanServer();
ObjectName objectName = new ObjectName("com.jprofiler:type=Profiler");
mbeanServer.invoke(objectName, "start", null, null);

Best Practices
JVM Monitoring Best Practices
- Enable JMX for remote monitoring
- Configure appropriate security settings
- Use appropriate sampling rates
- Monitor key metrics regularly
- Set up alerts for critical thresholds
- Keep monitoring overhead minimal
- Regularly analyze monitoring data
- Document monitoring procedures
- Use appropriate tool combinations
- Implement proper logging
- Enable proper security
- Use proper authentication
- Enable proper encryption
- Implement proper backup
- Follow monitoring guidelines
Conclusion
Effective JVM monitoring is essential for maintaining application performance and reliability. By understanding and utilizing these tools properly, you can identify and resolve performance issues before they impact users.